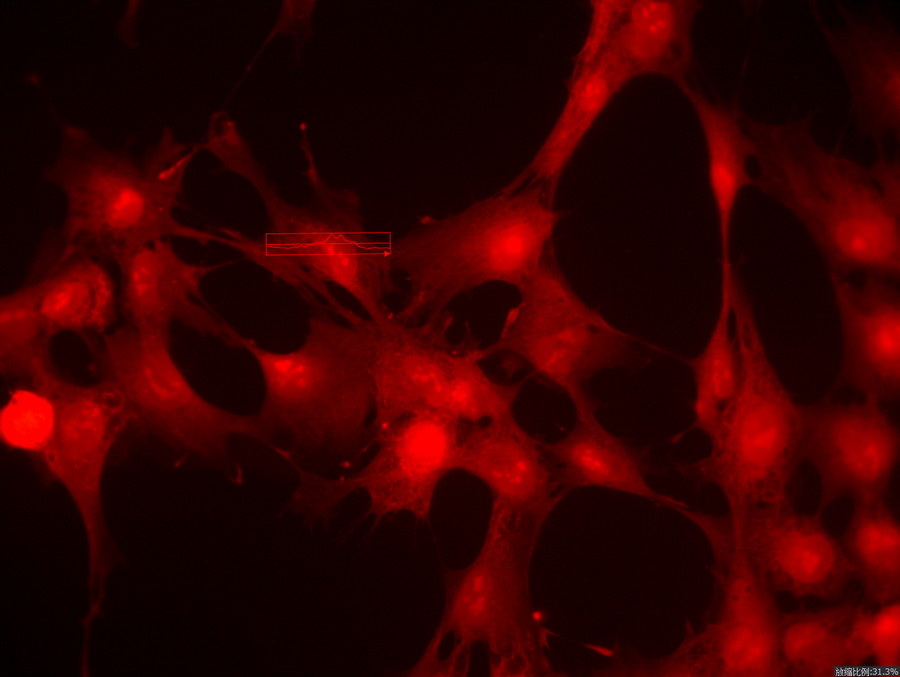
Fluorescence intensity analysis is one of the commonly used skills in papers. It can quantify the fluorescence intensity and conduct comparative analysis or statistical analysis to obtain credible results. Today we will introduce how to use the MSHOT microscopic digital measurement and analysis system and image J to quickly implement radial fluorescence intensity analysis.
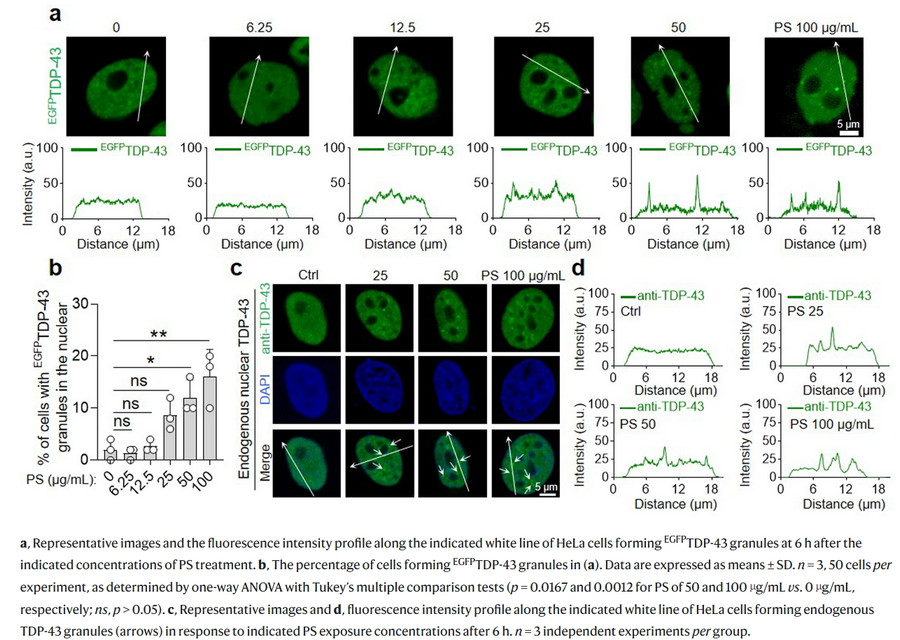
I、 Energy Curve Tool
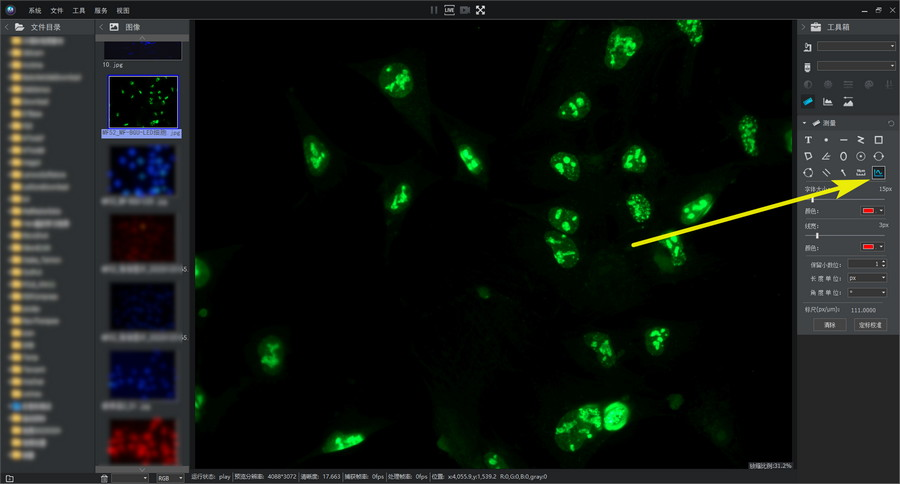
Energy curve is one of the tools of the MSHOT microscopic digital measurement and analysis system. It can visually display the changes in fluorescence intensity on a radial straight line. It has the advantages of convenience, ease of use, and intuitive results.
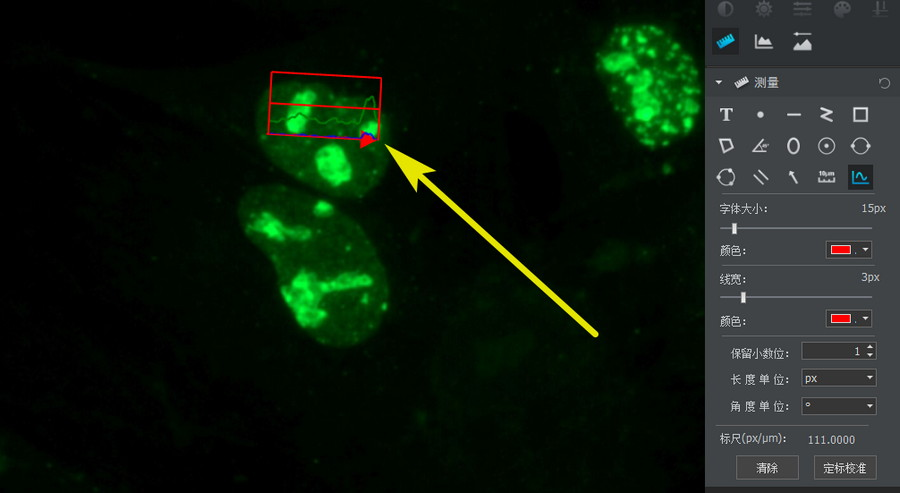
The energy curve is very simple to use. After selecting the tool, you can draw a line on the imaging window or picture, and then the system will generate a curve graph on the line. The red, blue, and green fluorescence will be presented as red, blue, and green curves respectively. The curve graph uses the line drawn by the user as the X-axis and the light intensity as the Y-axis. The Y-axis has two lines, 100% and 50%, which can quickly estimate the fluorescence intensity.
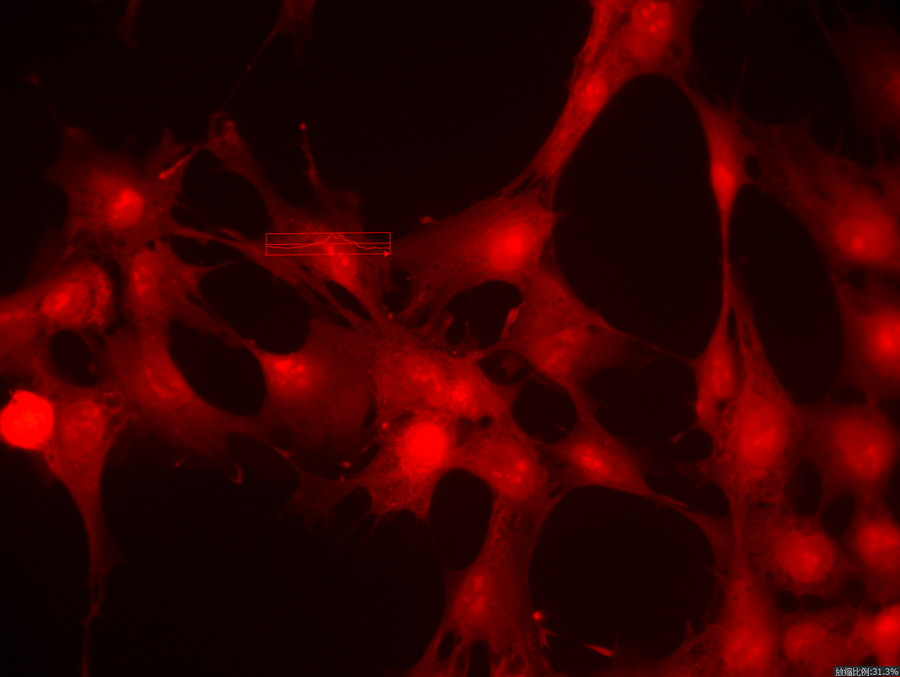
In monochromatic fluorescence, the energy curve can be used to quickly judge the fluorescence intensity for comparison to obtain scientific research inspiration, or for exposure control to avoid overexposure of the ROI target resulting in the loss of important detailed information. In multi-color fluorescence, the energy curve can also be used to quickly determine the co-localization of fluorescence.
II、Image J/FIJI quantitative analysis
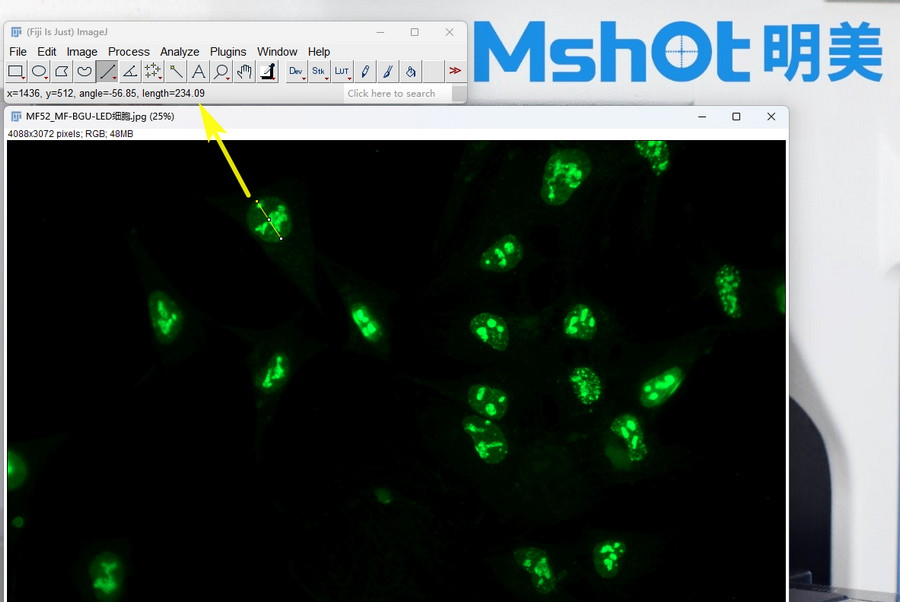
The energy curve is convenient and easy to use, intuitive and fast but not quantitative enough. To conduct radial fluorescence intensity analysis more quantitatively, you need to use image J or FIJI (JIFI is an updated version of imageJ). First open the fluorescence image and use the straight line tool to draw a line. Note that the length data must be consistent when comparing the lines.
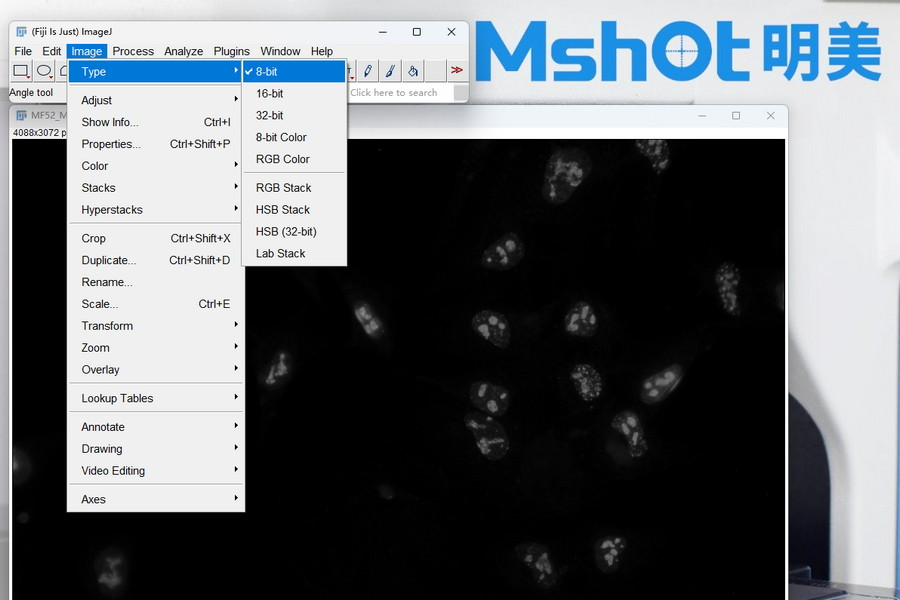
Our fluorescence image is a single-color fluorescence, so we first convert it to 8bit format to reduce problems that may be caused by other channel signals. Select image-Type-8bit in the menu option.
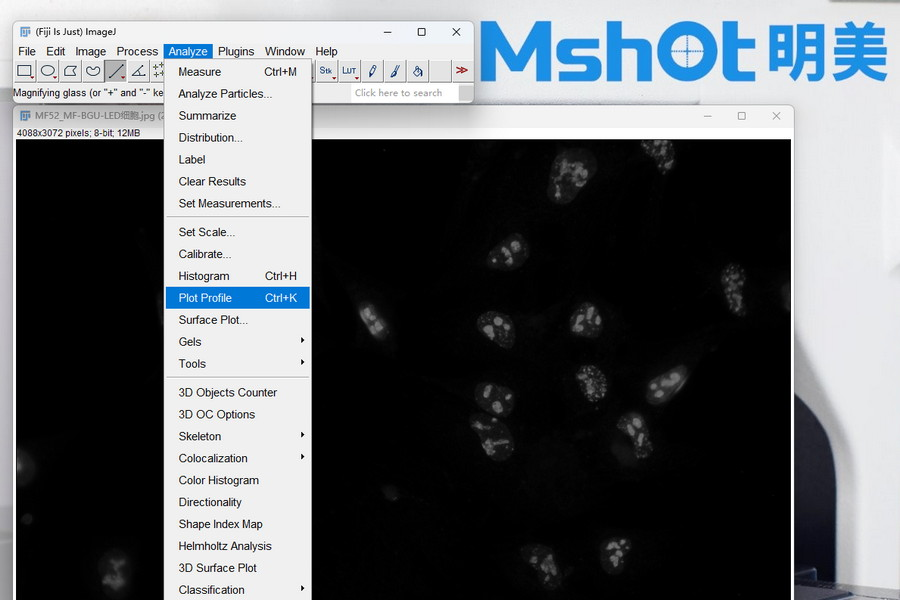
Next, open Plot Profile. You can open it from the menu Analyze-Plot Profile, or you can directly press the K key on the keyboard to open it. After opening, a straight-line light intensity curve will be displayed.
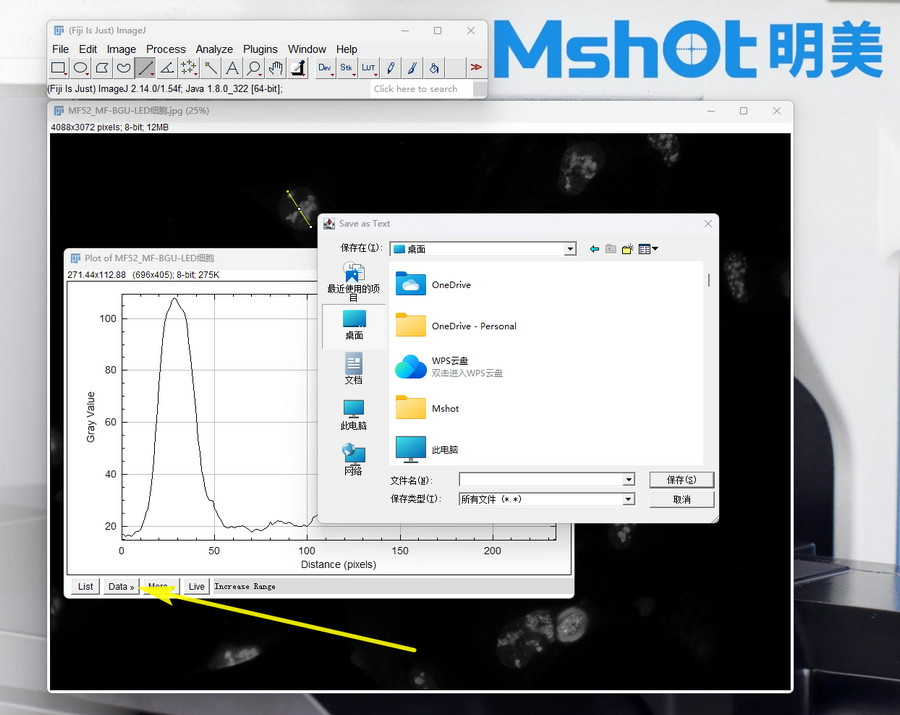
Click Data-Save Data in the graph window, the data can be exported to CSV format, which can then be opened with tools such as Excel or Origin for subsequent statistical analysis or curve drawing.
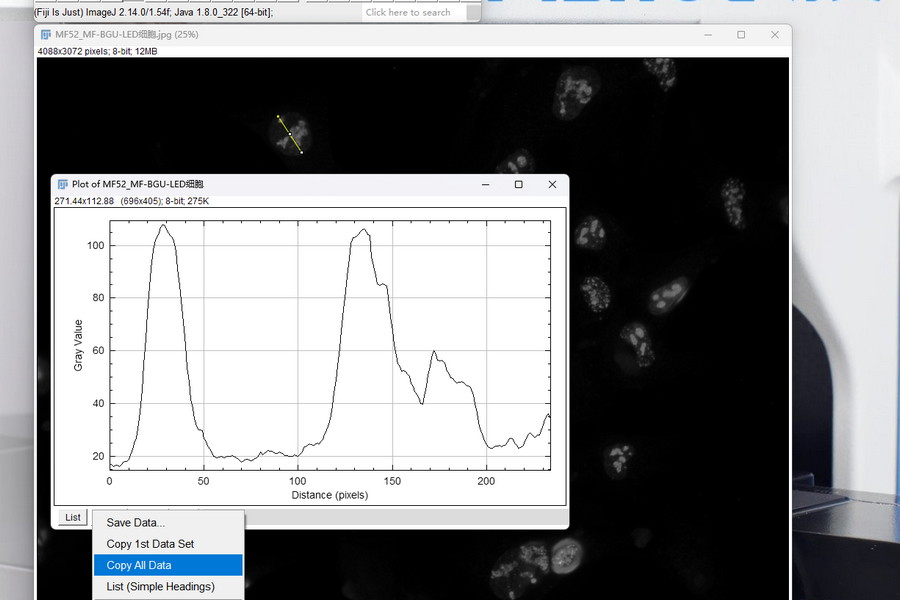
In addition to Data-Save Data exporting to a file, you can also use Data-Copy Al Data to copy the data to the clipboard, and then paste it directly into the already opened Excel, reducing the trouble of saving multiple data files.
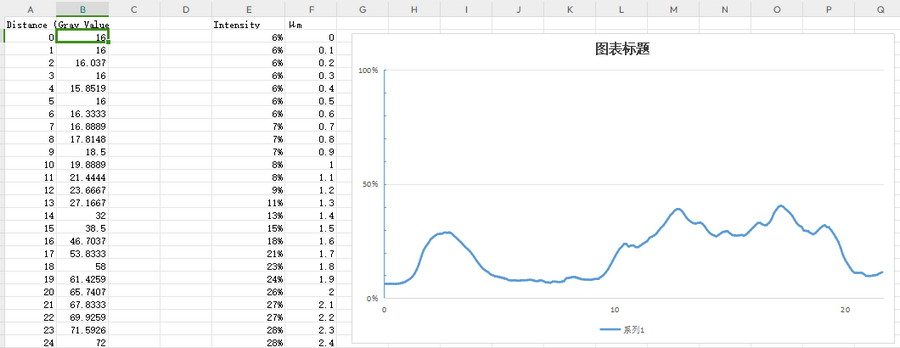
A small reminder, if you want to make a picture like the above paper in Excel, you may need to go through data processing. The first column is pixels, which need to be converted into size according to the software ruler, usually μm; the second column is fluorescence intensity, because the data is 8 bit , so the value is 0-255. Convert 255 to 100% to draw the Y-axis.
That’s it for today’s article sharing. I hope it will be helpful to everyone’s daily work. If you have any usage skills you would like to know, please feel free to tell us.
Cited documents:
@Sun, H, Yang, B, l, 0. et al. Polystyrene nanoparticles trigger aberrant condensation ofTDp43 and amyotrophic lateral sderosis-like symptoms. Nat.
Nanotechnol.(2024).https:/doi.org/10.1038/s41565-024-01683-5

